If you’re worried that a fresh bear market might be around the corner, you’ll want to put your present portfolio through its paces.
By stress-testing your stock investments, you’ll know how your portfolio would fare in any selloff and can think through what actions you could take to improve its resiliience.
It might be best to do nothing. But then again, like any savvy gardener, you might want to prune your portfolio so it’s ready for winter.
If you’re worried that a wobble in US stocks could turn into something uglier, but still feel confident about the long-term prospects of your investments, you might be wondering what to do. And, sure, you could think about selling your stocks and buying them back after a dip, but that involves trying to perfectly time the market, and that rarely works out for anyone. Or you could do nothing, and keep your eyes on the long-term prize. That’s often the safer option – after all, the selloff might never happen anyway.
But there’s also a third option, and it’s the best of the three: you could stress-test your portfolio. Here’s my simple, two-step guide.
Step one: see how your stocks hold up under pressure.
Look, all selloffs are different, and that means your stocks probably won’t perform in the next one exactly the way they did in previous ones. But, if you take a bunch of market selloffs, going back, say, 25 years, and examine how your stocks have done on average during those declines, that’s a pretty good test of their resilience. And doing that can be a great first step to stress-testing your entire portfolio.
The following table shows an equally weighted portfolio of 20 stocks – all of which I own in my personal portfolio (although not at equal weight). This exercise, then, is a very real-time stress-test for my own portfolio: I’m writing as I go, and I don’t yet know the outcome. But in the end it should tell me which of my stocks are best equipped to handle some rough conditions. So let’s get to it…
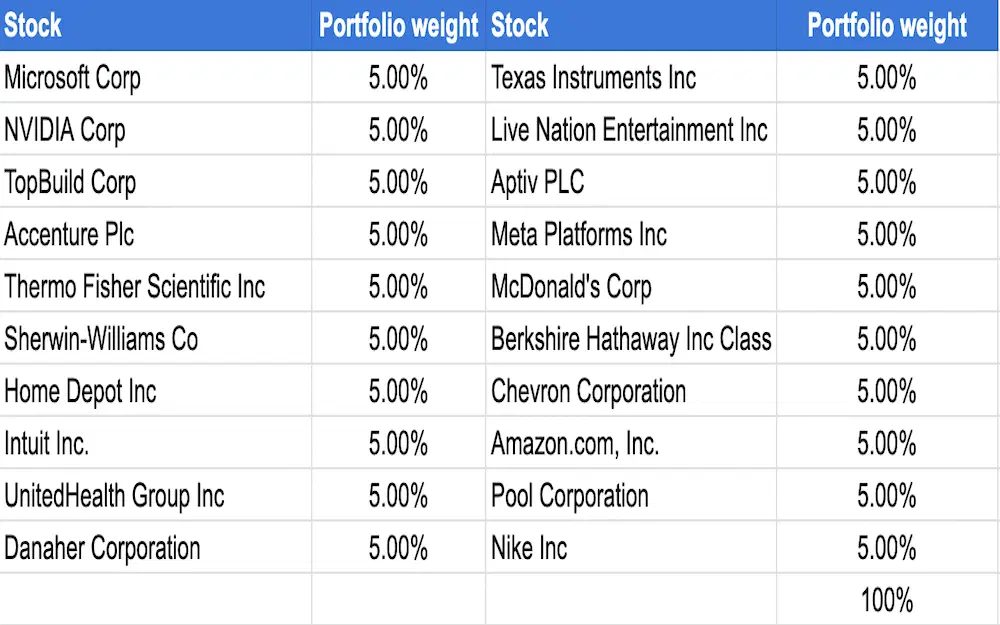
Equally weighted 20-stock portfolio.
Okay, to test how well these 20 stocks will hold up under some intense selling pressure, let’s look back and see how they did during three major bear markets – the dot-com bust, the global financial crisis (GFC), and the Covid crisis. I’m using the peak-to-trough moves of the S&P 500 to define these periods.
To stress-test this portfolio, then, we’ll assume that any future selloff will equal the average of the past three. So that suggests that Microsoft would drop 43% in a future selloff, for example, since that’s the average of the past three declines for the stock. It fell 59% in the dot-com bust, 43% during the GFC, and 26% during the pandemic.
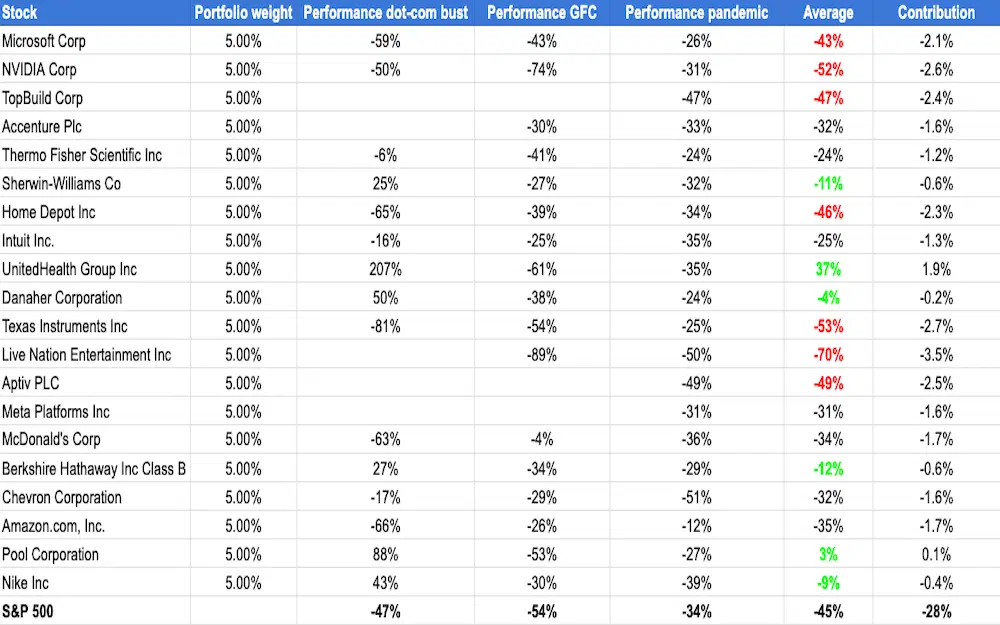
A 20-stock portfolio, equally weighted, with each stock’s price performance (measured on a total return basis) during each of the past major bear markets. Source: Koyfin.
Step two: decide what – if anything – to do.
As a professional US equity fund manager, the first thing I’d want to know is how this portfolio would fare against the S&P 500. That’s because anything better than the performance of that index would be considered a good outcome for me. Now, as a retail investor, that comparison’s less relevant, because outperforming the S&P 500 doesn’t win me any prizes. But, if I think of the S&P 500 index ETF as a potential alternative investment to the stocks I’ve hand-chosen for my portfolio, then it’s still a worthwhile comparison.
The good news is I’d expect this portfolio to decline by just 28% (I know, I know, it’s a lot) if these stocks did as badly as they did on average in the previous big market drops. You can see that in the last column of the table – contribution – which takes the current weight of each stock and multiplies it by my expected performance (i.e. the average column). You can add all those stock contributions together to get the expected portfolio performance.
As a pro fund manager trying to beat the S&P 500, I’d probably be happy with that 28% drop, on the basis that it’s loads better than the 45% average drop for the overall S&P 500. As a retail investor, though, I’m not exactly jumping for joy at the prospect of losing close to 30% of my portfolio’s value. But deciding to sell the assets that fare the worst in a hypothetical crisis isn’t easy either. I like all my investments for the long term, and I don’t really want to sell any of them. I also don’t actually know that we’re destined for a selloff: it’s all a bit of what-if exercise. For me, then, it’s a toss-up between sitting on my hands and staying true to my long-term beliefs, or reshuffling my portfolio to make it a bit more defensive, which might soften the blow of any market selloff, if one arrives.
To be honest, I’m not sure yet which way I’ll go. For now, I’ve highlighted in green the assets that performed much better than the S&P 500 during past market selloffs: these are the stocks I might buy more of, increasing their weight in my portfolio. Highlighted in red, meanwhile, are the stocks that performed much worse than the S&P 500 in those periods. And I’d reasonably expect them to do so again. Conveniently, it just so happens that those “red” stocks have done especially well of late, so a bit of profit-taking could be a nice idea anyway. If I do nothing else, I may lighten up on those stocks, so my portfolio (and I) can better cope with any possible upcoming market stress.
-
Capital at risk. Our analyst insights are for information purposes only.
Join the Investors' Club
Get access to professional investing tools for free and start building your wealth today!
Capital at risk