Since 2010, US stocks have trounced their international counterparts. This was mainly thanks to the "Magnificent Seven", which drove nearly all of the US earnings growth during the past decade and pushed up the S&P 500's valuation.
However, betting on continued US dominance is essentially a bet on a repeat performance from the Magnificent Seven. But an encore is highly unlikely because maintaining such extraordinary growth rates is a lot more challenging at the cohort’s current size.
Before 2010, US shares actually lagged international stocks. None of that suggests that Americans should go completely against their home bias and invest entirely overseas. However, folks might want to think twice if they’re completely neglecting international markets.
Plenty of folks tell you to overcome your “home bias” and seek some further-flung investment opportunities. The rationale is simple: by investing abroad, you can tap into great businesses worldwide and potentially achieve better returns. But, recently, that sage advice has been tested like never before, particularly among US investors. And that makes this a good time to check out the virtues of global diversification.
Why are US investors so down on global diversification?
For nearly a decade and a half, US stocks have trounced their international counterparts. Young investors in their 20s and 30s probably don’t even remember a time when US shares didn't dominate. Since 2010, the S&P 500 has delivered an impressive annual return of 13.3%, including dividends. In contrast, the MSCI EAFE index, which tracks developed markets in Europe, Australasia, and the Far East, has returned less than half of that – 5.9% annually. The MSCI Emerging Markets (EMs) index fared even worse, with a meager 3.2% yearly return.
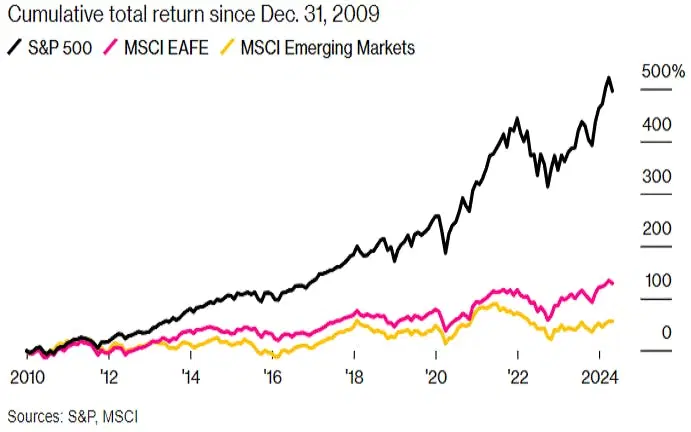
US stocks (S&P 500) have significantly outperformed developed market stocks from Europe, Australasia, and the Far East (MSCI EAFE) and emerging market stocks (MSCI Emerging Markets) since 2010. Source: Bloomberg.
With results like these, you can see why American investors tend to stay close to home. Vanguard founder John Bogle was always skeptical about international diversification, arguing that US companies provide enough exposure to overseas markets, since so many of them have significant global operations and revenues. Similarly, billionaire investor Warren Buffett has long steered investors to the S&P 500, despite his own investments in Europe and Asia.
Can US stocks keep outshining their peers?
A closer look at how US shares outperformed their international counterparts, combined with an analysis of global stocks’ longer track record, suggests that the past 15 years of American dominance may be more “exception” than “norm”.We can break down stock returns into three sources: earnings growth, dividend yield, and changes in the valuation multiple, i.e. the price-to-earnings (P/E) ratio. Between 2010 and April 2024, S&P 500 earnings grew at an annual rate of 14.1% – much faster than the 10.6% earnings growth of developed market international shares and the 2.9% growth of emerging market shares.Valuation changes also play a big role.
The S&P 500’s P/E ratio, based on trailing 12 months earnings, increased to 25x from 20x over the period. In contrast, the MSCI EAFE’s multiple fell by half, to 15x from 30x, while the P/E on the MSCI EMs shrank to 15x from 18x. Finally, although dividend yields are generally higher outside the US, the difference between the three indexes tended to be within 1.5 percentage points of each other.So essentially, the S&P 500’s better earnings growth and its valuation expansion helped drive its outperformance over international stocks.
And that begs the question: what drove those two key factors? And the answer is simple: a handful of US tech companies – including Alphabet, Amazon, Apple, Meta, Microsoft, and Nvidia – amassed near-monopolistic power that turbocharged their profit growth and, in turn, the S&P 500’s earnings growth.This group – which, along with Tesla, is known as the Magnificent Seven – accounts for nearly all of the US earnings growth during the past decade. In fact, the cohort posted profit growth of 36% a year since 2015, the longest period for which data is available, while the earnings of the other 493 firms in the S&P 500 grew only 6% a year. That strong showing has left the Magnificent Seven accounting for almost a third of the S&P 500 today – and that’s also contributed to the index’s rising valuation since high-growth tech stocks trade at higher P/E ratios.
Now, betting on continued US dominance is essentially a bet on a repeat performance from the Magnificent Seven. Without their influence, US stocks over the past 15 years have shown nothing particularly exceptional. But an encore is highly unlikely because maintaining such extraordinary growth rates is a lot more challenging at the Magnificent Seven’s current size. If they were to increase their earnings at the same relative pace during the next decade as they did during the previous one, they’d eventually make up more than 80% of the S&P 500 by market value, according to calculations by Bloomberg.And let’s face it: that’s unlikely. What is likely is that the Magnificent Seven’s growth will slow, and as that happens, their valuations will decline too.
How were US stocks doing before 2010?
No one could’ve predicted the rise of the Magnificent Seven and the subsequent dominance of US stocks back in 2010. On the contrary, back then, there was little reason to favor the American market.The MSCI EAFE index’s track record stretches back to 1970, and during the next four decades, it returned an average 10.2% annually – slightly outperforming the S&P 500’s 9.9% yearly average.
Over rolling ten-year periods, the EAFE Index outperformed 56% of the time.The underlying fundamentals were also closely aligned. The MSCI EAFE and the S&P 500 both saw average earnings growth of 5.7% per year, from 1973 to 2009, according to the earliest data available for the EAFE index. Valuations for that index expanded by 0.9% annually over the period, compared to 0.5% for the S&P 500. And, remember, dividend yields in developed international stocks are generally higher than in the US – but not by a lot.EM stocks also presented a compelling case over US equities before 2010. The MSCI EMs delivered an impressive 13.8% annual return from 1988 to 2009, surpassing the S&P 500 by 4.3 percentage points.
That was driven by stronger earnings growth from EM companies, and almost identical valuation expansion. And as with developed market international stocks, dividend yields in EM countries are generally higher than in the US – but only modestly.In other words, based on the historical record in 2009, it would have been impossible to foresee that US stocks would dominate over the next 15 years. Similarly, just as the period before 2010 was a poor predictor of what followed, the years since 2010 may also provide a poor preview of what lies ahead.
What does this all mean for investors?
None of this suggests that American investors should abandon their US stocks and invest entirely overseas. However, they should think twice if they’re completely neglecting international markets. A more balanced approach would be to track the global stock market with low-cost index funds, like the iShares MSCI ACWI ETF (ticker: ACWI; expense ratio: 0.32%), which holds over 2,000 stocks across 23 developed markets and 24 emerging markets. American companies represent around 65% of the ETF’s weight, so investors can rest assured that they’re still getting a substantial amount of exposure to good-ole US stocks.
Join the Investors' Club
Get access to professional investing tools for free and start building your wealth today!
Capital at risk