Forecasting ten-year returns for a 60/40 portfolio involves more than just initial valuations: it also requires integrating key economic indicators like growth and inflation. Goldman Sachs has devised a robust framework that leverages these factors to project future returns across four distinct economic scenarios.
Goldman’s research suggests that in the next decade, returns on a 60/40 portfolio could vary widely – from optimistic outcomes of 7% to 10% annually in perfect Goldilocks conditions to a more conservative 3% to 5% during periods of stagnation or stagflation. This range is somewhat lower than historical averages, and that’s primarily because of how high valuations are and how tricky the economic environment has become.
You have three strategies to consider: you could keep on with the standard 60/40 approach and potentially face lower returns in challenging economic climates; recalibrate the stocks and bonds allocation according to your big-picture outlook; or diversify with inflation-resistant assets and growth stocks to boost stability and enhance potential returns.
For decades, the growth and inflationlandscape was pretty perfect for the classic 60/40 portfolio, but since the pandemic, it’s just not been the same. And with US stockvaluations leaving little room for error and the economic picture still a bit of a question mark, you might be wondering what kind of returns you can expect for the strategy over the next ten years. So I’ve taken a close look at what’s next and the moves you might want to consider now.
How do you forecast the ten-year returns of a 60/40 portfolio?
Predicting the next decade’s returns for the classic 60/40 portfolio (i.e. the traditional “balanced portfolio”, with 60% held in stocks and 40% in government bonds) isn’t just about current valuations. Sure, more naive valuation metrics like starting yields for bonds and Shiller cyclically adjusted earnings yields (the inverse of the famous Shiller cyclically adjusted price-to-earnings ratio, or CAPE) for stocks can offer a decent jumping off point, but they’re inadequate over shorter horizons or when big economic shifts tweak what “fair value” might be because of changes in growth or inflation.
See, over five to ten years, the performance of a 60/40 portfolio becomes heavily influenced by macro factors like economic growth, inflation, and policy shifts. Typically, stocks thrive when the economy is strong and inflation is modest, and bonds flourish in scenarios where growth and inflation both keep their cool. So the sweet spot for a 60/40 portfolio often aligns with a “Goldilocks” scenario of good growth paired with low inflation – the winning combo we've been riding for about 15 years. With its heavier lean toward stocks, it’s no shocker that the toughest times for this portfolio are when growth is sluggish and inflation is stifling – like we saw in 2022.
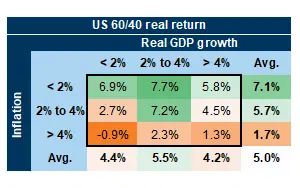
The average yearly return over any ten years, based on the growth and inflation mix. Source: Goldman Sachs.
Put differently, the 60/40’s returns hinge not just on their starting valuations, but also on the current cocktail of growth and inflation.
This is when Goldman Sachs’ brain power comes in handy: the banks’ analysts have developed a method to forecast long-term returns by considering both valuations and macroeconomic conditions. Here’s their framework:
Stocks: They break down the S&P 500’s total returns as follows:
S&P 500 forecasted returns = Dividendyield + Earnings growth + Change in Shiller P/E.
Goldman starts by aligning earnings growth with nominal economic growth, tweaking it for corporate profitability. They tackle valuation changes by comparing current valuations to a “fair value”, derived from a regression on inflation and return on equity (ROE) – the gist being that lower inflation and higher ROE boost this fair value. So if the fair value of stocks has permanently shifted upward, thanks to better fundamentals, then high valuation levels might not need to dip back down to historical averages. This means stocks could still dish out solid returns, fueled by earnings growth and dividends.
Bonds: Here’s how they dissect US 10-year Treasury returns:
US 10-year forecasted bond returns = US 10-year bond yield + Duration * (change in US 10-year bond yield).
Here, duration is the bond’s sensitivity to changes in interestrates, while the change in yields is deduced by establishing a fair value based on regressions against real economic growth (that is gross domestic product growth, adjusted for inflation) and inflation rates themselves. Higher economic growth and inflation rates translate into higher yields at maturity, and lower bond returns, all other things being equal.
By blending these individual forecasts, which account for both valuation and macro conditions, you can then forecast the overall returns for a 60/40 portfolio. Goldman’s methodology has proved its mettle, capturing about 85% of the variability in ten-year returns – far outstripping using valuation alone, which only explained 58% of returns over the same horizon. It beat using valuation alone by an even wider marginon a shorter five-year horizon.
So what returns can you expect for the next ten years?
With US stock valuations at high levels and bond valuations lingering around the average, much will depend on the big-picture outlook – which seems really uncertain right now. That means there’s a wider range of possible outcomes that could unfold for those portfolios.
To navigate this uncertainty, Goldman Sachs applied its forecasting model across four potential economic scenarios:
Goldilocks. Imagine a thriving economy where annual growth is 3% (that’s above its post-2000 average), with inflation at a low 2% (slightly below its post-2000 average). The 10-year yield dips lower, while stock valuations remain at their current high levels.
Goldilocks + AI boost. Picture AI boosting productivity, which pushes annual growth up to 4%, while inflation remains stable at 2%. The 10-year yield reaches a solid 4.9%, and stock valuations stretch even higher.
Stagnation. In this less-optimistic scenario, growth slows to 1.5%, and inflation to 2%. The 10-year yield drops to around 2%, and stock valuations decrease to more modest levels.
Stagflation. Here, growth remains sluggish at 1.5% but inflation spikes to a red-hot 6%. This pushes the 10-year yield even higher, and stock valuations notably lower.
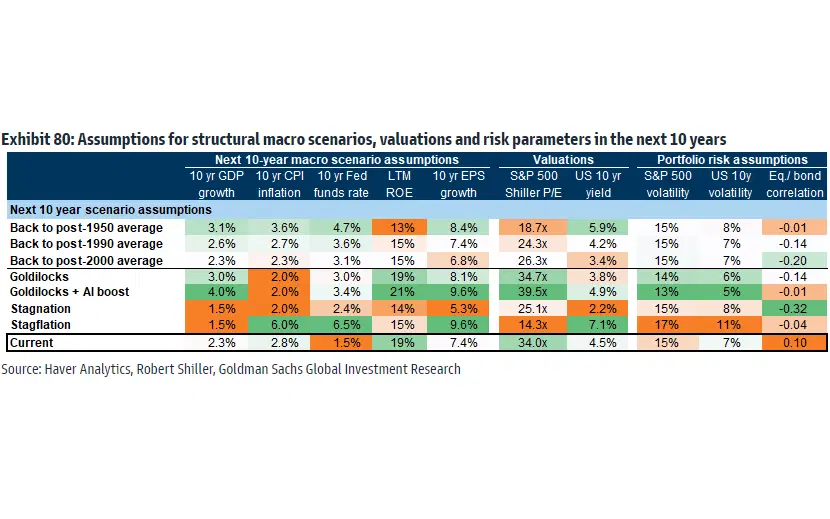
Detailed assumptions for the four economic scenarios. Source: Goldman Sachs.
Now, here’s what this could mean for returns:
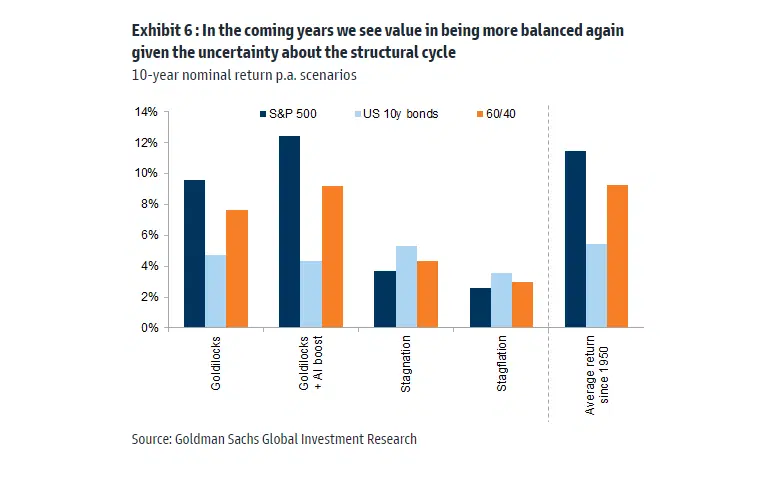
Nominal returns (before adjusting for inflation) for stocks, bonds, and the 60/40 portfolio under four different economic scenarios, along with their historical average returns since 1950. Source: Goldman Sachs.
Optimistic: 7% to 10% per year in a Goldilocks environment.
In the Goldilocks scenario, expect stocksto rise 10% annually if the economy’s buzzing and up to 12% if AI gives productivitya hefty push. Bondsmight chip in with a respectable 4% or 5%, smoothing out the bumps from stocks and nudging the 60/40 portfolio’s returns to about 8%, or close to 10% with a little AI magic.
What’s interesting is that only the ultra-optimistic Goldilocks + AI mix could hit those historic high returns for a 60/40 (far right column in the chart). That’s because elevated US stock valuations are likely to temper any runaway gains. Plus, robust growth would keep interestrates up, which means bond prices wouldn’t see much of a price lift.
Cautious: 3% to 5% per year in a stagnation or stagflation environment.
If the economy hits stagnation or stagflation, you’ll want to brace for yearly returns of just 3% to 5%. Stagflation could drop stock returns to just 3%, with bonds not doing much better as a hedge. And that could leave you with some potentially sharp dips in your investment mix. Returns in real terms – after adjusting for inflation– would likely be negative. Stagnation (i.e. low growth and low inflation) might dampen stock gains to about 4%, but bond returns could deliver around 6% as interest rates fall. In those more challenging scenarios, the 60/40 could see returns halved compared to its long-term average.
So what should you do, then?
Well, sitting tight is one option – and it’s not necessarily a bad one, considering how tricky it is to time the market. But you have to accept the risks: steep initial stock valuations and bonds that aren’t great at shielding you from inflation mean everything has to line up just right for that 60/40 portfolio to churn out the 10% historical returns you might be hoping for. If inflation sticks around longer than expected or if economic growth hits a slow patch, you might see returns that are much less impressive – maybe even dipping into the negative after you factor in inflation. You’d be making a big bet on growth remaining strong and inflation low.
Your second option is to tweak your stocks and bonds mix. Goldman Sachs did some interesting analysis here, calculating the mix that would max out risk-adjusted returns (that’s the Sharpe ratio for you finance nerds) under different economic scenarios. They found that only in the super upbeat “Goldilocks + AI boost” scenario would it make sense to park 60% in stocks. In less rosy scenarios, you’d want to dial down your stock allocation a lot – down to zero in cases like stagflation.
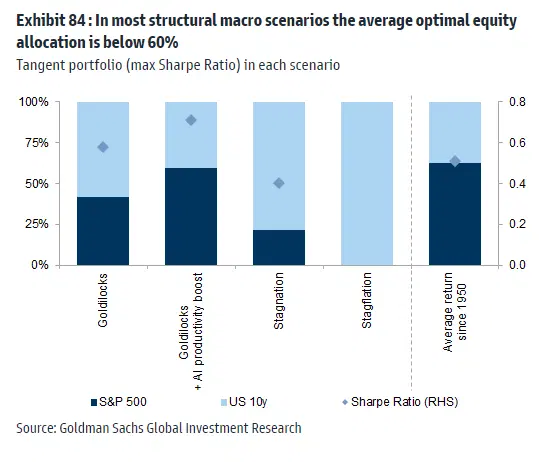
Optimal mix of stocks and bonds that maximizes the portfolio’s risk-adjusted returns in different macroeconomic scenarios. Source: Goldman Sachs.
So if you’re worried that we might hit tougher times than what’s baked into market forecasts, pulling back on stockscould be a solid option. That said, this strategy might mean missing out on bigger gains if things look up. In tougher times, your returns might still be underwhelming since bondsaren’t likely to provide the substantial lift needed to significantly enhance your portfolio’s performance. Essentially, the trade-off is settling for lower potential returns in exchange for greater stability across various economic conditions.
Your third option is to add assetsthat can handle inflationrisk better and help create a more balanced portfolio that has the potential to deliver attractive returns. As shown in the chart below, gold shines against the 60/40 mix during stagflation and stagnation – and that’s exactly when you need that resilience. Commodities tend to do well in stagflation, while real asset stocks could be your go-to during stagnation periods. Sure, diversifying might trim your gains in more favorable scenarios, but that’s a small price to pay for a sturdier, more well-rounded portfolio that isn’t dependent on perfect economic conditions to meet your long-term financial goals. Finally, if you want to capture a bit more upside in good times, you could consider adding growth stocks, which tend to outperform the broader stock market in Goldilocks scenarios.
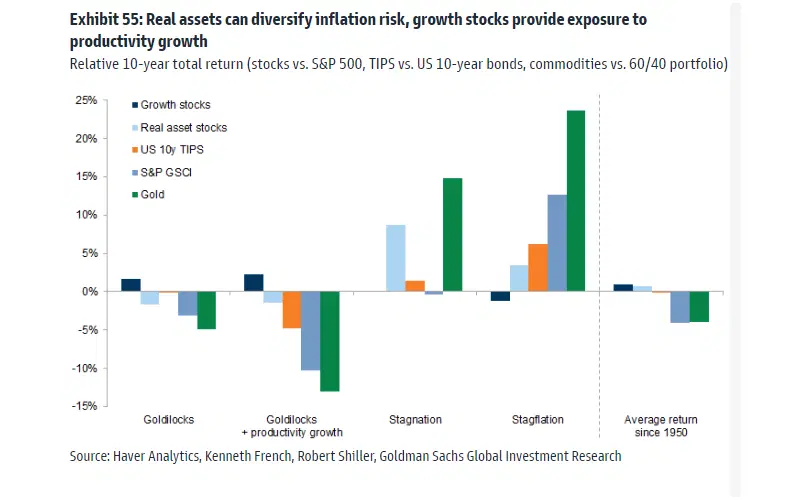
The relative performance of different assets, across different economic scenarios. Source: Goldman Sachs.
-
Capital at risk. Our analyst insights are for educational and entertainment purposes only. They’re produced by Finimize and represent their own opinions and views only. Wealthyhood does not render investment, financial, legal, tax, or accounting advice and has no control over the analyst insights content.


Join the Investors' Club
Get access to professional investing tools for free and start building your wealth today!
Capital at risk