When most people think about income investing, the first things that spring to mind are usually mature companies, legacy industries, developed markets, and low growth. And that makes sense: the go-to developed market income strategy certainly has its place in portfolios. But, look, there’s also a highly compelling case to be made for diversifying into emerging markets (EMs).
Once seen as offering slim pickings for dividend investors, today’s EM universe now offers an incredibly varied and attractive income hunting ground.
Just look at the dividend data.
The number of EM companies paying a dividend grew significantly in the ten years from 2001-2011. In fact, roughly 90% of them now pay dividends.
As you can see in Chart 1, the same proportion of companies in EMs pay a dividend when compared to developed markets (DMs). Perhaps more significantly, nearly 40% of EM companies pay a dividend that’s over 3%.
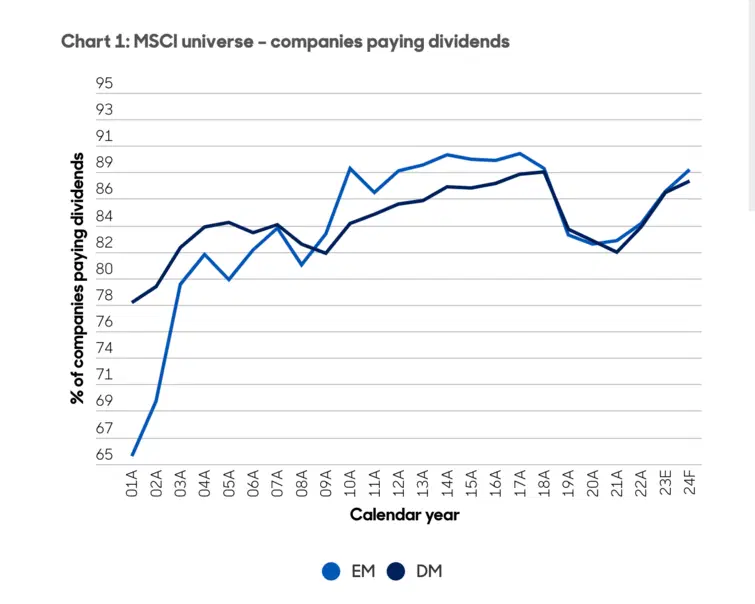
The proportion of EM companies with dividends increased significantly during the start of the previous decade (blue line). Using MSCI universe as it existed in the past. Based on local currency performance. Gross reinvested dividends without considering the impact of taxes. Sources: FactSet, Jefferies Equity Research, January 2024.
In my view, and in the view of abrdn, paying a dividend signals a shareholder-driven mindset on the part of company management, and a discerning approach to capital allocation.
In EMs, yield doesn’t preclude growth.
It's not uncommon for investors to assume that because income strategies are sometimes associated with mature companies, dividend investing means missing out on growth opportunities.
The thing is that in EMs, this isn’t the case. Strong corporate fundamentals and good underlying economic growth mean dividends have grown significantly faster in EMs versus DMs since the early 2000s. This has resulted in a compound annual growth rate (CAGR) of about 12% over the past 20 years, as you can see in Chart 2.
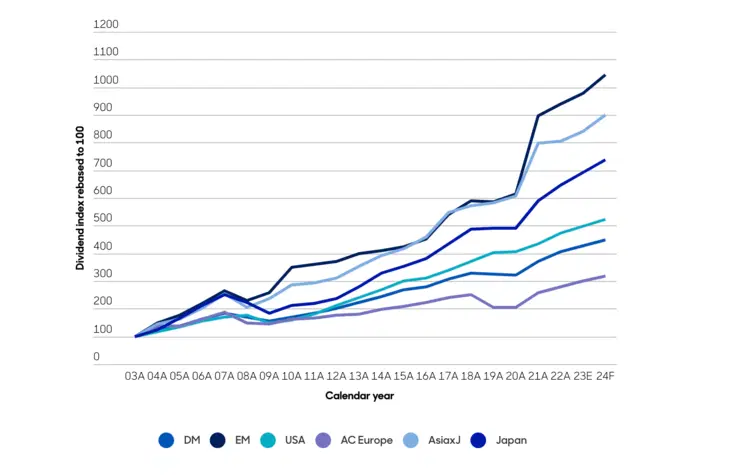
Last 20 years dividend CAGR (03A-22E). DMs = 7.5%; EMs = 12.1%; USA = 8.3%; AC Europe = 5.7%, Asia excluding Japan = 11.2%; Japan = 10.2%. Dividend index rebased to 100 (local currency, current universe). Bottom-up aggregated with free float adjustment in a year-on-year like-to-like basis for the current MSCI universe. Sources: FactSet, Jefferies Equity Research, January 2024.
Simply, EMs deliver on dividends.
Although many investors understand that income is a critical part of returns over time, they may not have given that a lot of consideration in an EM context.
Nonetheless, the opportunity is just as relevant for companies in EMs as it is in DMs. Chart 3 displays the two components behind the MSCI EM index’s total return over the past 22 years – price return and dividends.
The chart shows that dividend returns in EMs since 2000 have been one of the highest relative to other regions. The price return component representing half of investor returns is dominated by earnings growth, which, in turn, drives dividend growth. The other half of investor returns has come from the compounding effect of dividend payments.
The growth of earnings and the compounding of dividends in EMs mean active investors can combine dividend growth and high income, sometimes in a single stock. The superior growth characteristics of EM dividends (both from underlying growth of cash flows, plus rising payouts) is a trend that’s likely to continue.
Additionally, the coverage of dividends in EMs tends to be superior, with healthier balance sheets providing further support for the growth of payout ratios.
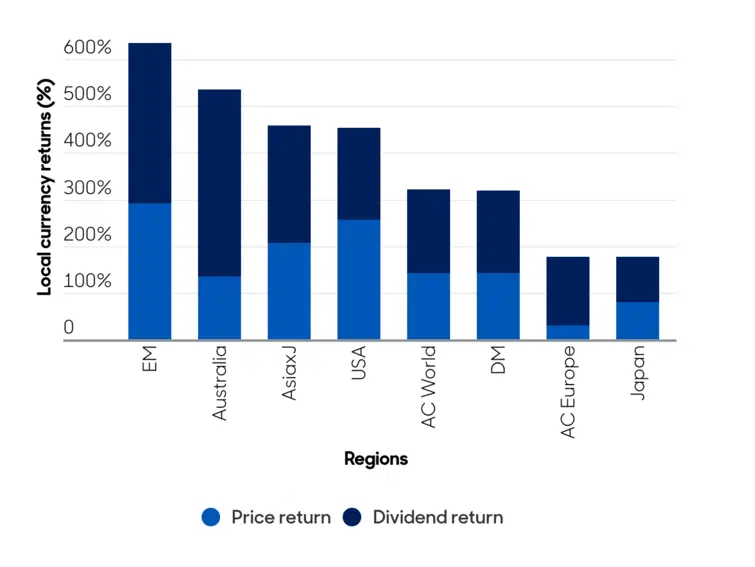
EMs, Asia ex-Japan, and Australia have had the highest dividend contribution to their total return since Dec 2000. Using MSCI universe as it existed in the past. Based on local currency performance. Gross reinvested dividends without considering the impact of taxes. Sources: FactSet, Jefferies Equity Research, January 2024.
There could be an opportunity here.
The EM universe offers lots of diverse income opportunities across sectors and geographies, as well as dynamic companies with the potential to generate valuable investment outcomes for clients.
What’s more, the trends discussed here would seem to further strengthen the investment case, suggesting the asset class might be particularly attractive for active income investors seeking a strong total return.
-
Capital at risk. Our analyst insights are for educational and entertainment purposes only. They’re produced by Finimize and represent their own opinions and views only. Wealthyhood does not render investment, financial, legal, tax, or accounting advice and has no control over the analyst insights content.
Join the Investors' Club
Get access to professional investing tools for free and start building your wealth today!
Capital at risk