Central bank and government support have helped “buy and hold” and “buy the dip” be the market’s favorite investment strategies.
The US economy's recent ability to sidestep recessions and attain higher productivity gains than the rest of the world has helped its stock market outperform.
The right investment strategy depends on your risk profile and the time you have available to spend on investing.
It’s just not easy being a bear, I guess – and in recent years, it’s not been terribly profitable either. The market’s far more bullish “buy and hold” and “buy the dip” investing tactics have instead proved wildly successful. So it’s worth taking a minute to look at why things have gone wrong for those gloomy bears, why the much fretted-about US recession never did materialize – and the strategies you might want now.
A long winter for bears, and a busy season for stimulus.
Those pessimistic bearish stock investors are a rare breed in the US and Japan these days, as stocks in both places dance around record highs. The S&P 500 and Japan’s Nikkei 225 recovered strongly from the Covid crisis, mostly gained while an aggressive string of US interest rate hikes aimed to bring down the country’s runaway inflation, and only briefly stumbled when a sudden rise in Japan’s currency, the yen, radically changed the math on a popular trade and sent global markets lower.
So it’s no wonder the buy-and-hold and buy-the-dip strategies have been so popular over the past decade.
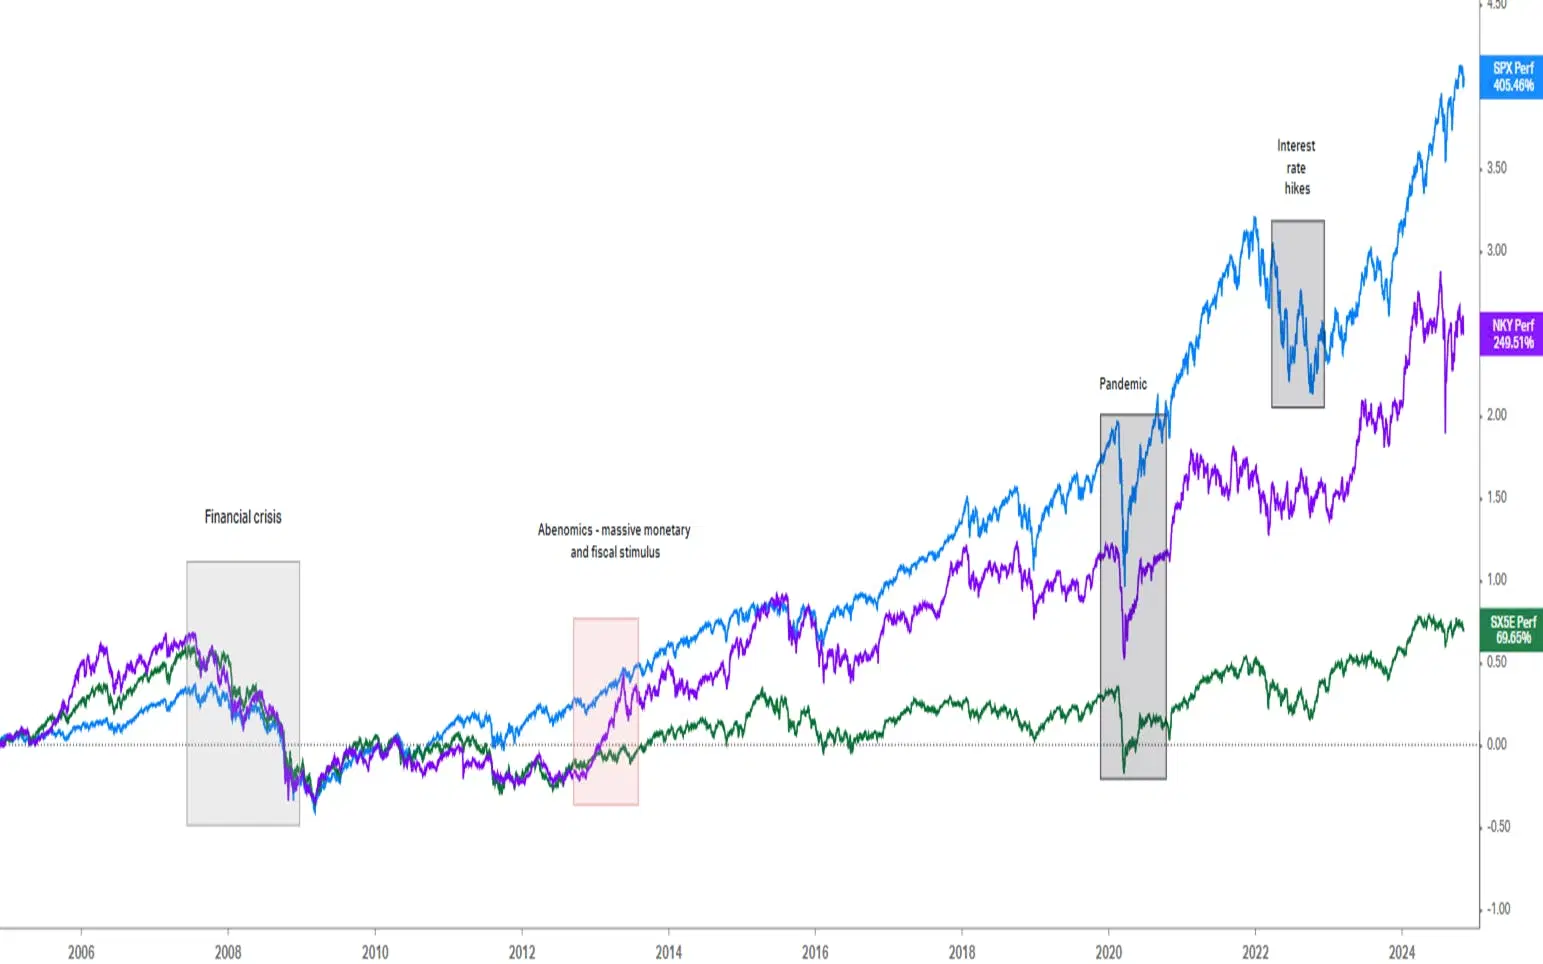
The S&P 500 (blue line), Nikkei 225 (purple line), and Euro Stoxx 50 (green line) indexes from 2004 to 2024. Source: Koyfin.
And though stocks have generally had it pretty good these past few years, plenty of experts have been steadily warning about an economic recession that seemed to be right around the corner, one that could surely send shares lower. They flashed around plenty of seemingly good evidence to back up their claims too. Nonetheless, there’s been no recession (so far) and stocks have generally just kept on ticking higher.
Now, this seems like a key moment to remind you that the stock market is not the economy. They do tend to dance to the same drum though: when the economy is humming along, when the job market is bustling, when consumers are confident and spending their money on goods and services – that’s when stocks tend to be at their best and earnings at their strongest.
A key reason for the stock market resilience, even in the face of so many hand-wringing expectations, is the hangover from years of central bank and government stimulus – specifically, years of near-zero interest rates and massive bond-purchase programs from the central banks, plus the pandemic-era payments to households from the government’s coffers. Buying up government bonds in giant quantities forces interest rates lower (because bond yields fall as their prices rise), which makes borrowing cheaper for consumers and businesses, and adds to the allure of higher-yielding assets like stocks or real estate. Economists credit those financial jolts with helping the countries bounce back from – or even stave off – downturns.
Back in 2013, the Nikkei began its stellar rally as Japan’s government and central bank started a super aggressive stimulus program. Similar strategies were used in the US, Japan, and Europe to boost the economy during the pandemic-driven slowdown. The table shows the sharp increases in the size of those countries’ central bank balance sheets – thanks to those massive bond-buying sprees – over time.
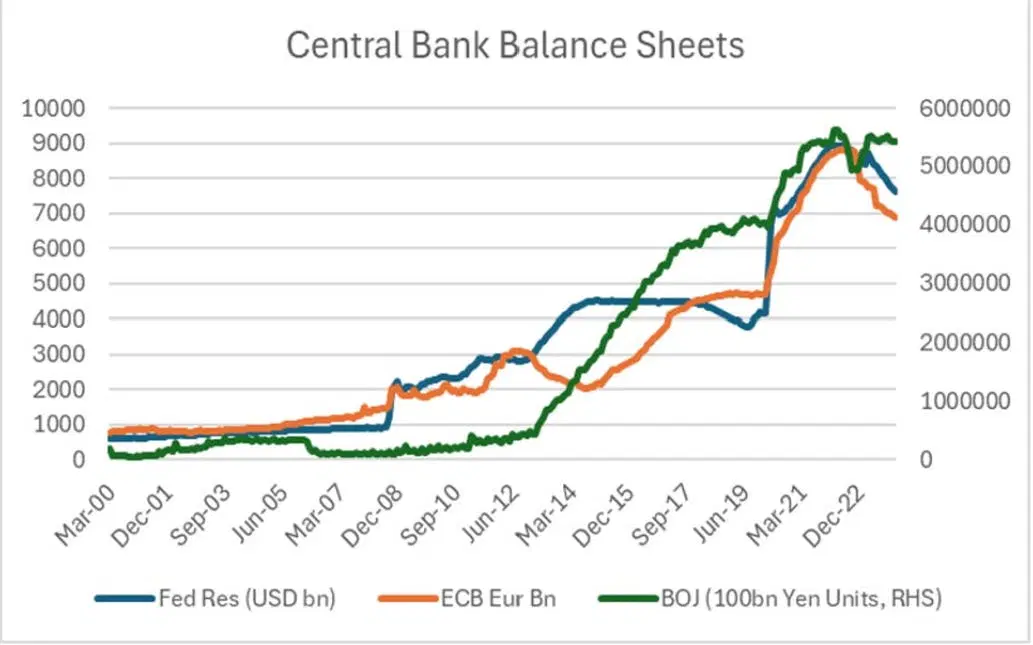
Size of the Federal Reserve’s balance sheet (blue), the European Central Bank’s (orange), and the Bank of Japan’s (green) from 2000 to 2024. Source: Russell Clarke.
Two recession indicators called it wrong (so far, at least).
Economists rely on a number of time-tested recession indicators to give them a sense of where things are going. But in the past few years, they’ve proved less-than-useful, signaling a coming recession that (at least so far) hasn’t materialized. Two of those, in particular, stand out for me.
An inverted yield curve is when short-term interest rates are higher than longer-term interest rates – for example, when the 2-year US bond yields more than the US 10-year Treasury one. Typically, the rule of thumb is that the longer the time horizon on the bond you buy, the higher the yield. It makes sense: you’re locking yourself in a yield for longer, accepting the risk that interest rates or inflation may rise. So you’d expect to be compensated with a higher premium than a shorter-term bond.
Typically, when that relationship turns on its head – as it did in the US in June 2022 – it’s because investors see the economy slowing.In 2022, the fear was that the Fed’s aggressive string of interest rate hikes wouldn’t just cool the country’s inflation, but would put the whole economy into a deep freeze. And, yeah, those higher rates did indeed cause a crisis, of sorts: with a plunge in lending and the collapse of Silicon Valley Bank in March 2023. But the Fed stepped in with an emergency rescue that protected all depositors (even those with more than the $250,000 maximum government-insured level), and extended credit directly to other banks that were nursing heavy losses on their bond holdings.
Every recession since 1955 has been preceded by a yield curve inversion, and the curve has only delivered one “false positive”, having inverted in 1966 without a recession following on its heels.Now, some might argue that the Fed’s influence on the financial markets is so high now, that old relationships have lost their predictive power. After all, the curve moved back to “normal” this year without a recession, after its longest inversion ever – 793 days.
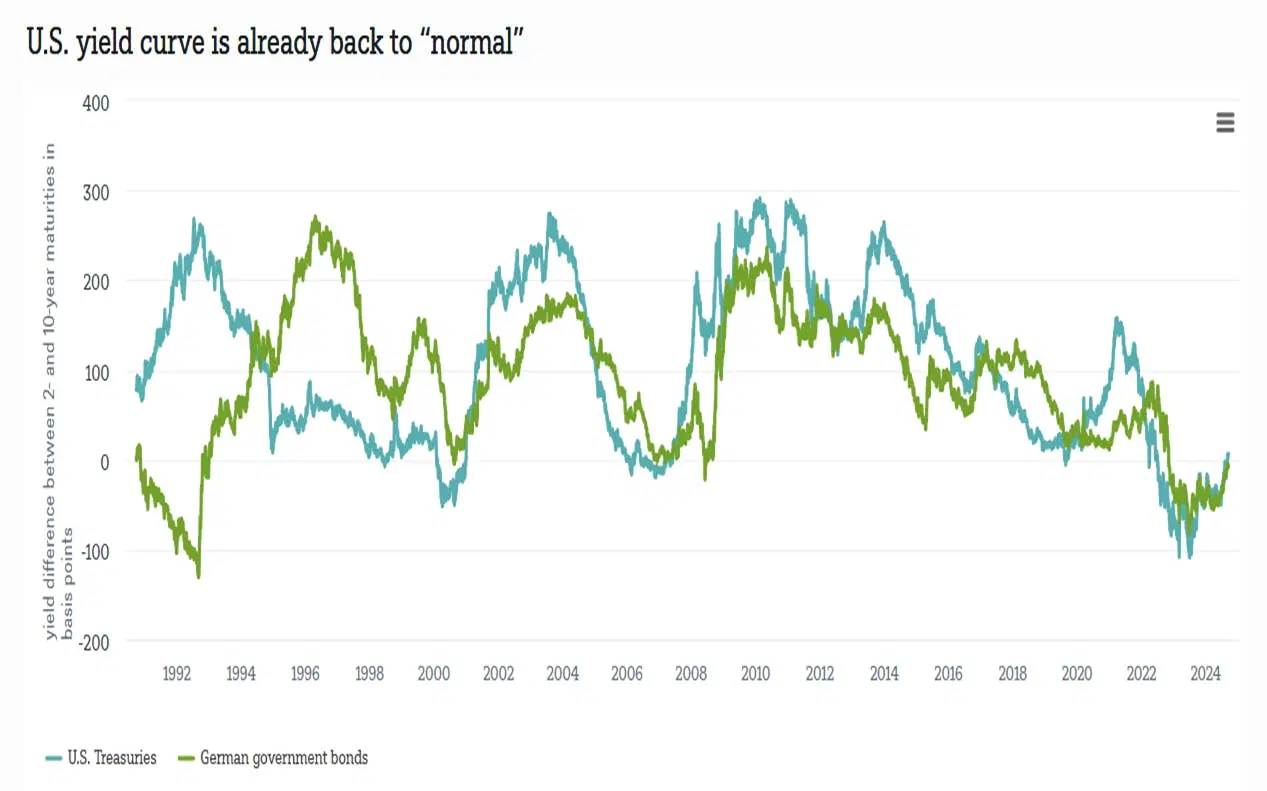
The difference between the 2-year and 10-year yields for US Treasurys (blue) and German bunds (green), from 1990 to 2024. Source: DWS.
The Sahm Rule is another trusted recession indicator. It says that if the unemployment rate’s three-month average rises by half a percentage point from its lowest level in the past year, recessionary conditions are already present or will be soon. It’s been a highly reliable tool and has accurately signaled every recession since 1970.In July 2024, a disappointing jobs report had the Sahm flashing its red light – along with increased predictions of an imminent recession. But it was a false indicator: an increase in people looking for work, including a surge of new immgrants, had driven the unemployment rate higher.
The US economy quickly proved much more resilient than expected though, and the unemployment rate soon dropped back down. And all of that happened without new recession-averting stimulus support.
And the role of productivity continues to be overlooked.
Without question, central bank and government support play a huge role in the economy – and by extension, that plays into stocks. But don’t overlook the big factor at play here: productivity gains.
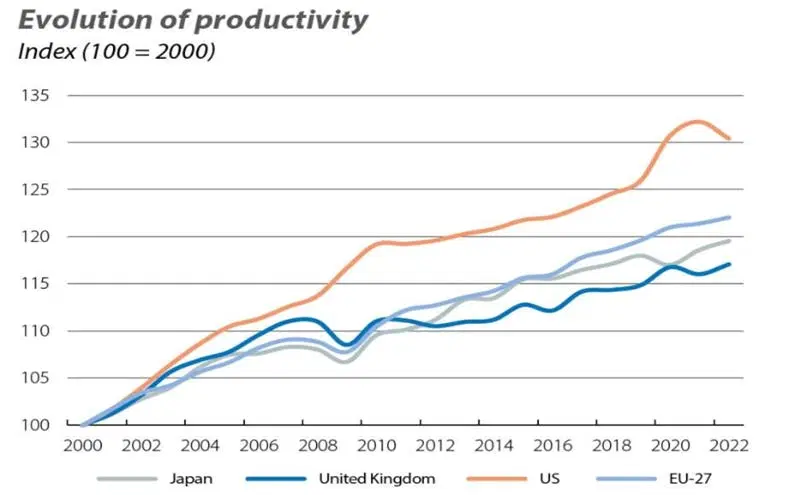
Productivity growth from 2000 to 2022, calculated as inflation-adjusted economic output per hour worked for the US, Japan, the UK, and 27 European Union countries. Sources: Caixabank, the Organisation for Economic Co-operation and Development.
Sharper increases in productivity in the US compared to the European Union (EU) over the first 22 years of this century drove a big gap between the per-hour output in the two regions, according to Caixabank. It’s one of the key reasons why US stocks have outperformed those from other areas, and one of the key advantages the US currently holds is in technology and AI.
So where’s the opportunity here?
Finding the right strategy depends on your risk profile and the time you have available to spend making investment decisions. It’s always a good reminder that time in the market and not timing the market is what matters in building wealth.
The SPDR S&P 500 ETF (ticker: SPY; expense ratio: 0.1%) continues to be a top choice, but the index is heavily weighted toward the Magnificent Seven, so naturally the fund is too – and that makes it a big sector bet on tech. To tone down your tech exposure, you could consider the S&P Equal Weight ETF (RSP; 0.2%) which offers more broad-based exposure to the biggest US stocks. If you’d like to take a more active approach – and have a little more time available, then Stéphane’s sector momentum investing strategy could be a good match.
Or, if you’re looking for a more diversified approach to your overall investing mix, the Finimize Easy Rider Model Portfolio may be worth the test drive.
---
Capital at risk. Our analyst insights are for educational and entertainment purposes only. They’re produced by Finimize and represent their own opinions and views only. Wealthyhood does not render investment, financial, legal, tax, or accounting advice and has no control over the analyst insights content.
Russell Burns
Join the Investors' Club
Get access to professional investing tools for free and start building your wealth today!
Capital at risk